







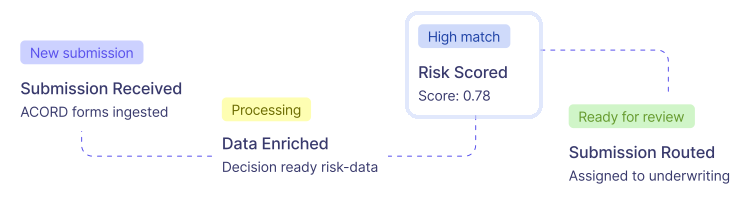

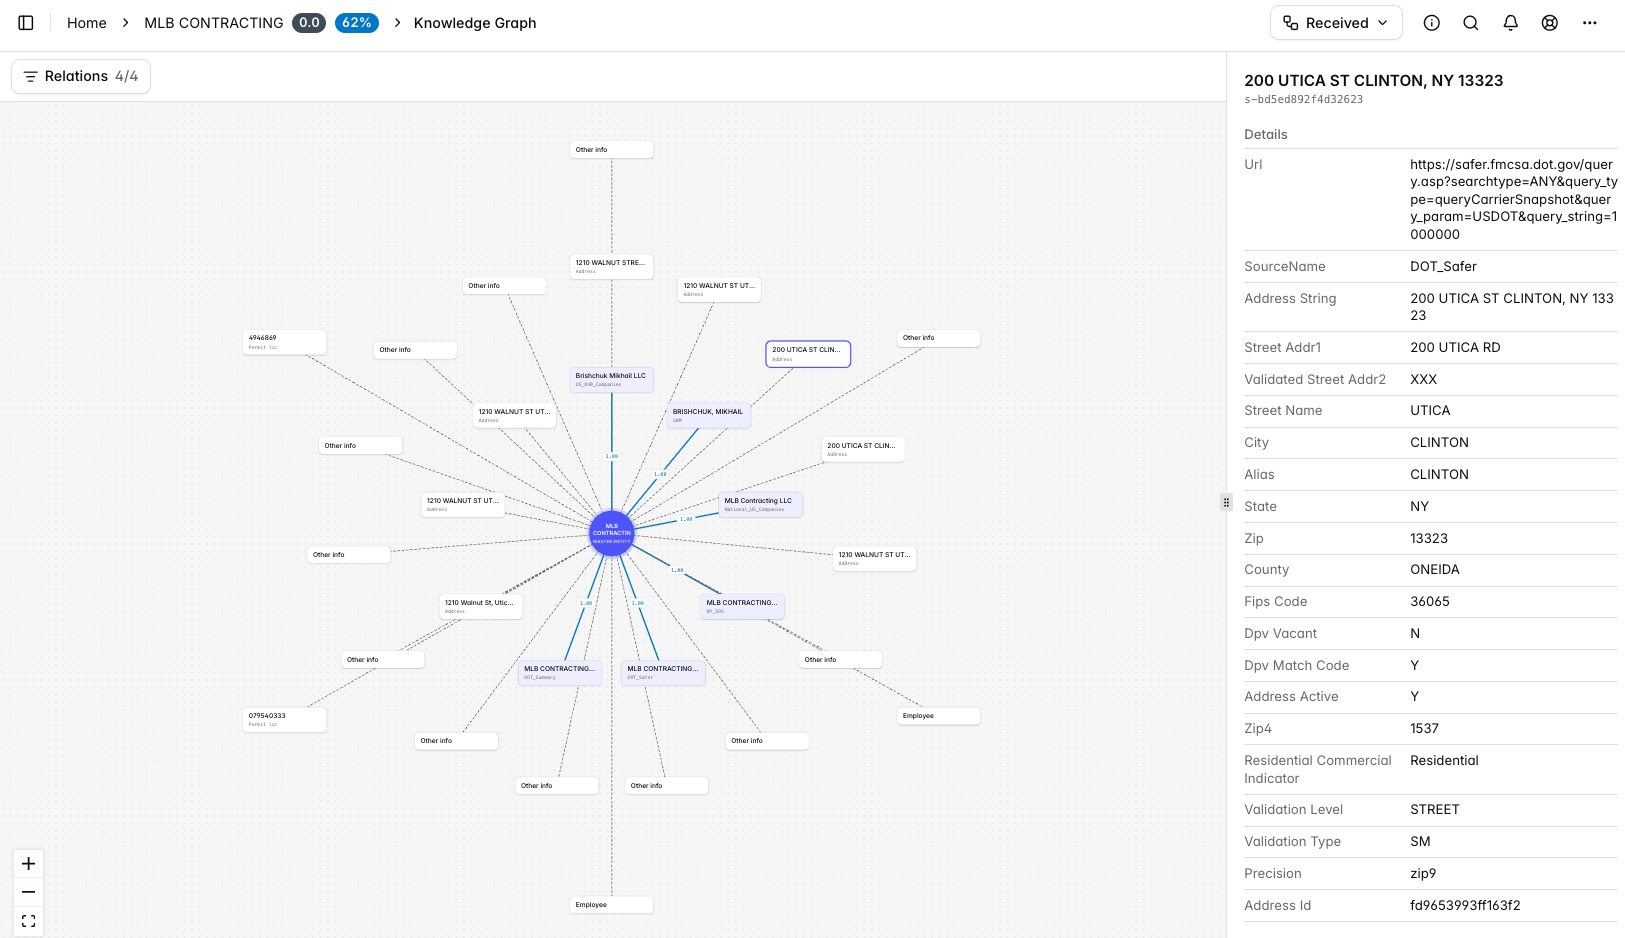
With auditability and governance top of mind, Convr® has designed a new graphical representation of the purpose-built P&C insurance ontology that powers its Risk Context Engine. The new visual map defines how classes of business, exposures, hazards, and risk attributes relate to one another, while tracing them to the source.
Rather than treating data as a flat list of fields within a table view format, the new knowledge graph gives Convr’s data meaning and context. In this way, Convr enables users to better interpret underwriting data, connecting a submission's raw data points into a coherent, consistent risk picture that's traceable and verifiable.
"Our new knowledge graph details every data element of a submission as the gray matter of a brain -- a mental graphic that shows exactly how every piece connects," said Harish Neelamana, Founder, President and Chief Product Officer at Convr. "Most companies keep their data in a black box. We're doing the opposite, giving underwriters an inside lens into the data lineage so they can see exactly how every data point connects."
“Convr's new knowledge graph improves usability, allowing users to see relationships and connections more clearly and explicitly interact with the data,” said John Stammen, Chief Executive Officer at Convr. “The update gives underwriters a transparent, visual window into a submission's entire data lineage, showing exactly how every element connects.”
Where many platforms bury data relationships in the background, Convr's knowledge graph makes those connections visible and traceable, helping underwriters move through submissions faster, with a clearer picture of each risk to justify their decisions. The feature reflects Convr's total commitment to transparency and explainability in AI-native underwriting.
.jpeg)